SOFTWARE DOWNLOADS
File Lister 0.2.5b
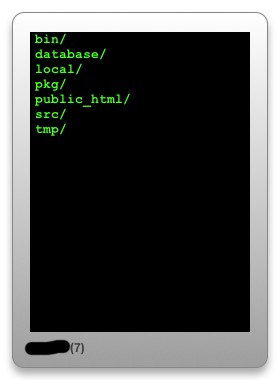
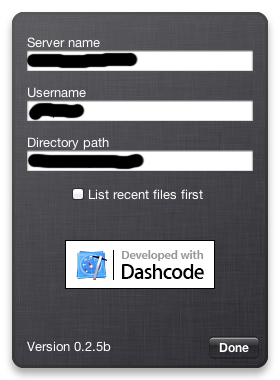
About File ListerSometimes you want to keep an eye on the files in a directory located on a remote Unix-based server. With this widget you can list the files on any server, for any user, in any directory as long as you can make an SSH connection to that server. If your password or passphrase is stored in the Keychain on your Mac computer, File Lister will make a secure connection with the server and list the files in the specified directory - right on your Dashboard. Want to monitor multiple directories? File Lister supports multiple instances without a problem.
HistoryVersion 0.2.5b- Fixed a bug that caused directory listings that placed "/" characters on the end of directories to list these entries improperly (default "ls" behavior is now enforced)
Version 0.2.4b
Version 0.2.3b
Version 0.2.2b
Version 0.2.1b
Version 0.2b
Version 0.1b
|
|
IDL Routines
The following IDL procedures and functions are utilities that I have developed over time and find useful in conducting my research on a daily basis. I am the author of these source codes. I have placed these source codes in the public domain. You can use, modify, and distribute these source codes and executable programs based on these source codes.
Color Science | |
| DELTAE | This function returns the computed color difference (deltaE) between two (2) provided RGB color triplets. The triplets are converted to sRGB (0-1), converted to tristimulus values (XYZ), converted to CIE L*a*b* where the color difference between them is computed using a simple Euclidean distance measure. |
| LAB2SRGB_IMAGE | This function converts a provided CIE L*a*b* color space representation image to an sRGB image assuming Illuminant D65. A non-linearity adjustment for the monitor response is applied to the provided data. |
| LAB2XYZ | This function returns the converted tristimulus values for a provided CIE L*a*b* value assuming a particular illuminant. |
| SRGB2LAB_IMAGE | This function converts a provided sRGB color image to a CIE L*a*b* color space representation image assuming Illuminant D65. A non-linearity adjustment for the monitor response is applied to the provided color data. |
| SRGB2XYZ | This function converts a provided sRGB color triplet to tristimulus values. The sRGB values are assumed to be in the range [0,1]. A non-linearity adjustment for the monitor response is applied to the provided color data. |
| XYZ2LAB | This function returns the converted CIE L*a*b* values for a provided tristimulus value assuming a particular illuminant. |
| XYZ2SRGB | This function converts a provided set of tristimulus values to sRGB. The tristimulus values are assumed to be in the range [0,1] and computed with illuminant D65. A non-linearity adjustment for the monitor response is applied (gamma = 2.2). |
General | |
| ANGLE_BETWEEN_TWO_VECTORS | This function will compute the angle between two provided vectors (or arrays of vectors) in n-space. |
| ARRAYS_ARE_SAME_SIZE | This function will check if two provide arrays are the same size. This routine only checks the dimensions (no other characteristics are considered). |
| CREATE_DCT_MATRIX | This function computes the DCT matrix that can be used in place of the discrete cosine transform for square, two-dimensional block data. This matrix, M, is used as Y = M ## X ## M' to compute the DCT, Y, of the square, two-dimensional data array X. |
| DCT1D | This function computes the one-dimensional discrete cosine transform (or its inverse) of the provide vector. |
| DCT2D | This function computes the two-dimensional discrete cosine transform (or its inverse) of the provide two-dimensional data array. |
| DOT_PRODUCT | This function will compute the dot product between two provided vectors (or arrays or vectors) in n-space. |
| IS_EQUAL | This function will determine if two scalars are equal. This function is intended to be used when comparing two floating point values to determine in they are "close enough" to each other to be considered equal. |
| MAGNITUDE | This function will compute the magnitude (length) of the provided n-dimensional vector. |
| NORMALIZE | This function will normalize or compute the unit vector equivalent for the provided vector. |
| NORMH | This function normalizes the provided array by the homogeneous coordinate. |
| PRINT_LATEX_TABLE | This procedure will create LaTeX code for a table from a provided two-dimensional array. |
| PRINT_STRUCTURE | This procedure will print the contents of a structure to the console, in a name/value pair format. This will allow the user to view the contents of the sturucture in a more readable format. |
| RANDOM_SAMPLE | This function will return a vector of "n" random elements selected from either a provided vector OR from a produced vector of "N" elements using a long data index generator. The returned random elements will be unique, that is, no individual element in the array may be selected twice. |
| REPLICATE_VECTOR | This function will replicate a provided vector as either the rows or columns of a 2-dimensional array. This provides a utility similar to the REPLICATE functions provided in IDL for scalar values. |
| ROTATE3D | This function will perform a rotation of the provided homogenous point in 3-space. The result represents the orthogonal matrix corresponding to a clockwise/left-handed rotation with Euler angles angleX, angleY, and angleZ with x-y-z convention. |
| TAG_EXISTS | This function will search a structure for the existence of a specified tag. |
Graphics | |
| FACET_VERTICES_TO_PLANE_COEFFICIENTS | This function will compute the coefficients of a plane equation of the form Ax + By + Cz + D = 0 from a set of triangilar facet vertices. The surface normal can also be computed if desired. |
| PLOT_ENHANCED | This procedure serves as a wrapper around the IDL PLOT procedure that adds the ability to produce encapulated Postscript versions of the plots using the original IDL plot format or with the popular GNUPLOT package which is available for most platforms (this package must be installed separately and available in your path before this capability will be functional). |
| PLOT_SPHERICAL | This function will create a three-dimensional quadilateral-faceted plot of spherical coordinate data. The data provided must represent magnitudes defined at a regularly-spaced set of declination and azimuth angles. |
| POINT_IN_POLYGON | This function will determine whether the supplied point is contained within the supplied general polygon |
| POINT_INSIDE_TRIANGULAR_FACET | This function determines whether a provided point (or set of points) falls within the boundaries of a triangular facet. This function uses the technique based upon the barycentric coordinate test described at http://www.devmaster.net/wiki/Ray-triangle_intersection. |
| RAY_INTERSECTS_FACET | This function determines whether a given ray (or set of rays) intersect a provided triangular facet in 3-space. |
Image Processing | |
| BILATERAL | This function performs bilateral filtering of a greyscale or multi- band color image. The filtering is based on a Gaussian distribution in both the distance and range domain and depends on the user-provided standard deviations in both of these domains. This function is capable of smoothing the provided image while maintaing edge detail. |
| DCT_BLOCK | This function produces a block DCT image (or its inverse) from the provided input data. |
| FAST_CORNER_DETECTOR | This function will return a 2xn array of corner coordinates identified in the provided greyscale image. |
| FILL_REGION | This function will use morphological operations to fill the interior region of a provided boundary image. |
| FIND_CENTER | This function will look at a cluster of pixels in a binary image and determine the mean coodinate of that cluster. It is assumed that there is only ONE cluster of pixels in the provided image. If there are more, then the mean coordinate of ALL cluster pixels will be returned, which is probably an undesirable result. |
| FIND_CLUSTER_CENTERS | This function will find the centroid coordinates for clusters located throughout a provided image. The clusters will first be refined by thresholding the provided image using the supplied digital count threshold value. |
| HARRIS_CORNER_DETECTOR | This function will find corners in an image. Corners are defined in this context as localized areas within the image were small shifts in the image in any direction produce a significant change in the composition of the neighborhood. |
| INTERACTIVE_CROP | The INTERACTIVE_CROP function will allow the user to select a spatial sub-region of the provided image that is to be cropped. The function will create a window and display the image provided for the user to interact with. |
| MAKE_BAYER | This function will construct a document mode image from a provided three-band color image [3,*,*] using the following Bayer pattern [ [G,R], [B,G] ]. |
| OTSU_THRESHOLD | This function uses Otsu's method to automatically perform histogram shape-based image thresholding, or, the reduction of a gray-level image to a binary image. The algorithm assumes that the image to be thresholded contains two classes of pixels (e.g. foreground and background) then calculates the optimum threshold separating those two classes so that their combined spread (inter-class variance) is maximal. |
| PERSPECTIVE_PROJECT3D | This function will perform a perspective projection of a three- dimensional point defined in homogenous coordinates onto a two- dimensional "focal plane" as if being acquired by a camera located in 3-space with a specified focal length, pixel size, and "look at" position. |
| PROJECTIVE_MAPPING_MATRIX | This function will compute the projective transformation matrix to allow the conversion between two sets of quadrilateral vertices, one set being considered the image and the other being considered the map. The determined transformation, mappingMatrix, can be subsequently used to convert a homogenous map coordinate [u,v] to a homogenous image coordinate [x,y]. |
| QUAD_TO_QUAD_PROJECTIVE_TRANSFORM | This function will perform a quadrilateral-to-quadrilateral projective transform of the provided image. The transformation is defined using the provided quadrilateral vertices defined in a clockwise order beginning at the upper left-hand corner. The provided image coordinates are targeted to fall at the provided map coordinates. |
| READ_ENVI_HEADER | This function serves to read an ENVI header directly into an IDL program. |
| READ_ENVI_IMAGE | This function serves to read an ENVI image/header directly into an IDL program without the need to first open that image in ENVI and use the ENVI_* routines to do so. |
| READPPM | This function serves to read a Netpbm format portable pixmap format (PPM) image. |
| SCRAMBLE_IMAGE | This function returns a version of the provided image in which the digital count value locations have been scrambled a specified number of times (numberTransformations) using toral automorphism (G. Voyatzis and I. Pitas, Applications of toral automorphism in image watermarking, Proceedings of the IEEE Conference on Image Processing, Volume 2, pp. 237-240, 1996). |
| SPATIAL_FILTER | This function will return a response from the spatial filtering of a one-, two-, or three-dimensional array with the provided one- or two-dimensional filter. If specified, this routine will properly rotate the filter before performing the filtering operation to perform pure mathematical convolution. |
| STDDEV_IMAGE | This function will compute the standard deviation in a local neighborhood around each pixel in a greyscale image. |
| WRITE_MP4 | This procedure will create an MPEG4 video file from the provided frames. The frames can be either greyscale or 3-channel color. |
| WRITE_PHOTOSHOP_CUSTOM_FILTER | This procedure will write a custom Photoshop filter to disk in the proper binary format. |
Interface | |
| CANCEL_PROGRAM | This procedure deletes all windows created by the calling routine, closes all files, and destroys the calling routine/widget. |
| ERROR_MESSAGE | This procedure creates an error message modal dialog box. |
| PAUSE_EXECUTION | This procedure pauses a routine's execution by creating a modal dialog box containing a message. Execution is paused until this dialog box is dismissed. |
Radiometry | |
| BB_RADIANCE | This function will return either the spectral radiance(s) at a specific wavelength or at a discrete set of wavelengths provided in an array or it will return the spectrally integrated radiance across a bandpass specified by the wavelength limits for a provided absolute temperature. |
| BB_TEMPERATURE | This function will return the blackbody temperature corresponding to either the provided spectral radiance or the spectrally- integrated radiance at the specified wavelength or within the specified bandpass. |
| DP_RADIANCE_CALIBRATION | This user-interactive procedure will produce calibrated radiance files from the sample and downwelling measurement files created by the D&P Instruments Model 102F MicroFT or the Model 202 TurboFT. This calibration requires the cold and warm blackbody files produced by the instrument also be provided. Sample data is provided here. |
| TES | This user-interactive procedure will perform a temperature-emissivity separation using a user-provided sample and downwelling radiance spectra. The spectra must be provided as a function of wavelength [micrometers] in units of W/m^2/sr/micrometer. |
Statistics | |
| GAUSSIAN | This function computes the value of a Gaussian distribution for a given random variate and a specified mean and standard deviation. |
| GENERATE_CORRELATED_DATA | This function will return a list of k normally-distributed, correlated, n-dimensional random points [with a specified mean vector and set of univariate standard deviations]. |
| MULTIPLE_LINEAR_REGRESSION | This function will perform a full-order multiple linear regression by constructing a full-order design matrix including all possible combinations of the provided independent variables (for example, if 5 independent variables are provided and a constant/intercept term is desired for a third-order model (order=3), then all 6-CHOOSE-3 three- term variable combinations will be placed in the design matrix). |
| PRINT_ANOVA | This procedure will display the ANOVA table given in the analyis structure along with the coefficients computed by the MULTIPLE_LINEAR_REGRESSION module. |
| RANSAC | RANSAC is an abbreviation for "RANdom SAmple Consensus". It is an iterative method to estimate parameters of a mathematical model from a set of observed data which contains outliers. It is a non-deterministic algorithm in the sense that it produces a reasonable result only with a certain probability, with this probability increasing as more iterations are allowed. The algorithm was first published by Fischler and Bolles in 1981. |
| RMS_EDGE | This function accepts two images, original and altered. The two images must have the same dimensions. The original image is converted to luminance, and then an edge mask is calculated. The edge mask is found by applying a gradient operator, applying a threshold, and then dilating the result. The edge mask is applied to both input images, and the RMS deviation is found for each channel separately. |
Matlab Routines
The following Matlab functions are utilities that I have developed over time and find useful in conducting my research on a daily basis. I am the author of these source codes. I have placed these source codes in the public domain. You can use, modify, and distribute these source codes and executable programs based on these source codes.
Image Processing | |
| read_envi_header | This function reads an ENVI header file and parses out the number of samples, lines, bands, data type, interleave type and byte order. These parameters are returned in an array. |
| read_envi_image | This function reads an ENVI image directly into MATLAB. |
Python Code
The following Python codes are utilities that I have developed over time and find useful in conducting my research on a daily basis. I am the author of these source codes. I have placed these source codes in the public domain. You can use, modify, and distribute these source codes and executable programs based on these source codes.
Color Science | |
| deltae | This method will compute the color difference (delta E) between two provided colors triplets or two provided color images. The colors provided are assumed to be in sRGB color space and viewed under illuminant D65. If the provided colors are individual color triplets, the return value will be a scalar delta E. If the provided colors are images, a delta E image and a scalar average delta E will be returned as a tuple. |
| xyz2srgb | This method converts a provided set of tristimulus values to sRGB. The tristimulus values are assumed to be in the range [0, 1] and computed with Illuminant D65. A non-linearity adjustment for the monitor response is applied (gamma = 2.4). |
General | |
| dist | This method will create a rectangular array (numpy.ndarray) in which each element represents the distance from the upper left position -or- in which each element is proportional to its frequency. This method is modeled directly after the IDL DIST function. |
Graphics | |
| plot | This method will plot the two-dimensional data set(s) provided and optionally display them to the screen or save them to a output graphics format file. This method serves as a wrapper for the Matplotlib module incorporating and simplifying the use of the more commonly available graphing option. The file must be placed in a directory named "graphics" that is located in your PYTHONPATH. An "__init__.py" file should be created in the "graphics" directory to insure that this module can be imported throughout your development environment. |
Image Processing | |
| bilinear | This method will perform color filter array interpolation on a generic document mode (Bayer) image. A simple neighbor averaging approach will be taken for each of the three patterned color channels. |
| laroche_and_prescott | This method will perform color filter array interpolation on a generic document mode (Bayer) image. A gradient-based approach is taken to avoid interpolating across edges to minimize color artifacting. The technique is an implementation of the following paper: C.A. Laroche and M.A. Prescott, "Apparatus and method for adaptively interpolating a full color image utilizing chrominance gradients", U.S. Patent No. 5,373,322 (1994) |
Interface | |
| terminal_menu | A class for creating a simple, terminal-based menu using the "curses" module for terminal handling for character cell displays. |
Statistics | |
| psnr | This method will compute the peak-signal-to-noise ratio (PSNR) between two provided data sets. The PSNR will be computed for the ensemble data. If the PSNR is desired for a particular slice of the provided data, then the data sets provided should represent those slices. |
| rmse | This method will compute the root-mean-squared error (RMSE) between two provided data sets. The RMSE will be computed for the ensemble data. If the RMSE is desired for a particular slice of the provided data, then the data sets provided should represent those slices. |
C Code
The following C codes are utilities that I have developed over time and find useful in conducting my research on a daily basis. I am the author of these source codes. I have placed these source codes in the public domain. You can use, modify, and distribute these source codes and executable programs based on these source codes.
Image Processing | |
| libip | These codes offer simple wrapper routines around the popular libjpeg JPEG reference library and the libdc1394 IEEE 1394 camera control and capture library. |
Scripts
The following scripts are utilities that I have developed over time and find useful in conducting my research on a daily basis. I am the author of these scripts. I have placed these scripts in the public domain. You can use, modify, and distribute these scripts and executable programs based on these scripts.
Image Processing | |
| imagej | This bash script offers a user-friendly command-line wrapper for the ImageJ (v1.46 or later) running under Mac OS X. The ImageJ folder distributed by the NIH must be located in the Applications folder on your Mac for the script to be used as is. |